
The Numbers Don’t Lie
An Armageddon A-Go-Go Field Report on Elections, Data, and Friction
The Numbers Don’t Lie (But They Don’t Tell the Whole Story Either)
Cue something like Dayvan Cowboy the kind of track that makes everything feel expansive, even when you’re just staring at spreadsheets.
Everyone has a theory about elections. Fraud. Suppression. Rigged systems. So we did something radical: we looked at the numbers.
The Part Nobody Likes: The Data Actually Holds Up
When you line up ballots, votes, and population data across states, something unexpected happens: it all reconciles. The swing states, the ones everyone watches, litigates, audits, and argues about, show tight alignment between ballots counted and presidential votes, with cleaner consistency than 2016 and 2020.
- No evidence of “votes exceeding ballots” in the seven swing states
- Cleaner statewide reconciliation than the pre-2020 baseline
- No aggregate signs of a large-scale numerical breakdown
The Microscopic Problem
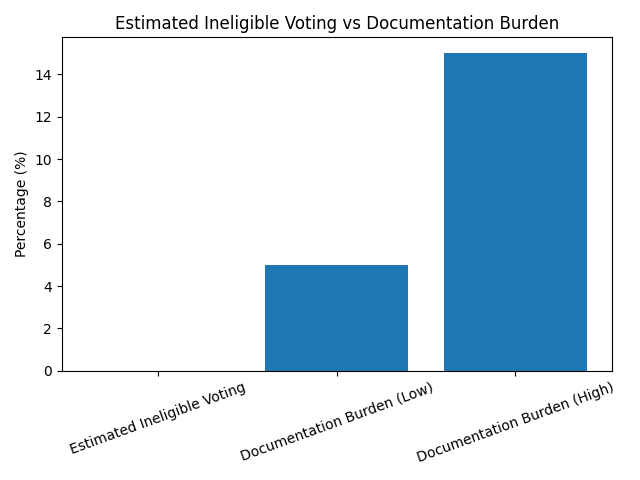
Measured rates of ineligible voting are tiny; on the order of 0.0001% to 0.002%. If this were a bug, it is the kind you need a microscope to complain about.
The system isn’t breaking from too many bad votes. It might change based on who finds it easiest to vote.
The Part Where Things Get Interesting
There is another number that matters much more for 2026 planning: roughly 5%–12% of eligible voters lack easy access to citizenship documents. Not ineligible. Not fraudulent. Just missing paperwork or not having it readily available.
| Factor | Estimated Scale |
|---|---|
| Ineligible voting | ~0.002% or lower |
| Documentation burden | ~5%–12% of eligible voters affected |
When Small Percentages Get Big Fast
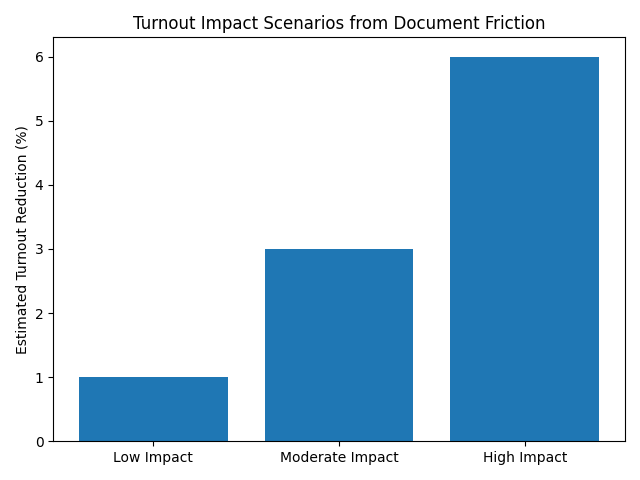
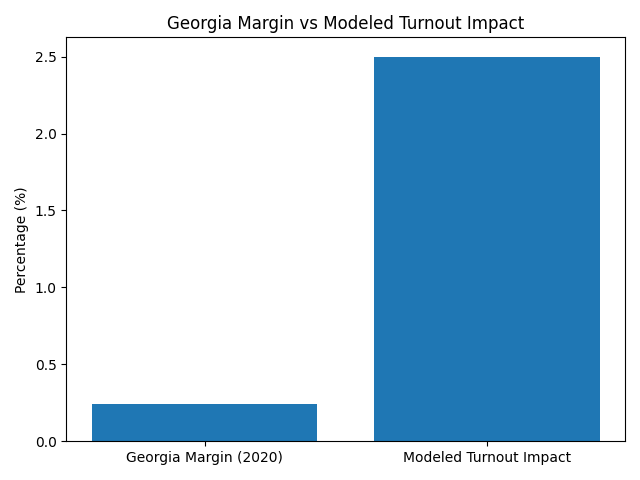
Even modest friction matters. If 8% of voters are affected and 10% of those drop off, that is an estimated 0.8% turnout hit. In close states, that is enough to move from abstract percentages to tens of thousands of votes.
This is the Hand Covers Bruise section, quiet numbers that scale quickly.
The Complication Nobody Wants
If you’re expecting a clean conclusion like “this clearly helps Party X,” reality is messier than that. Historically, some affected groups lean Democratic. But 2024 also showed that lower-propensity voters are more mixed than a lot of old assumptions allow.
What About Gerrymandering?
Gerrymandering affects districts, not presidential statewide totals. But when you combine geographic concentration with turnout friction, you are no longer just changing lines on a map, you may be changing who successfully participates in the first place.
The REAL ID Plot Twist
Most Americans have already proven citizenship at some point. The problem is not verification. The problem is that the system does not retain or expose that proof in a way election systems can reliably use later.
The problem isn’t verification. It’s that the system forgets what it already knows.
Methodology & Data Sources
- Statewide election totals reconciled against ballots-counted datasets and registration baselines
- Historical comparison across 2016, 2020, and 2024 swing-state behavior
- Modeled turnout friction scenarios based on documentation access constraints
- Policy interpretation framed around scale, not speculation
Important note: This analysis uses aggregated public data and modeling assumptions to illustrate scale and likely impact. It is designed to test plausibility and pressure-test narratives, not to predict exact outcomes with false precision.
Final Thought
By the end, it is less analysis and more ambient Eno—everything resolved, nothing fully answered.
The numbers check out. The consequences still might not.
Welcome to Armageddon A-Go-Go. Everything works. And that might be the part worth paying attention to.